Chipotle Mexican Grill (CMG) shares plunged Thursday after the fast casual chain served up a lackluster same-store sales outlook.
The company said it expects flat comparable store sales this year, below its prior forecast of a low single digit growth rate, signaling that inflation and recession fears are taking a bite out of consumers’ fast food dining budgets. Still, the burrito maker said it plans to drive traffic growth by beefing up advertising, elevating hospitality, and offering more promotions at its restaurants.
Chipotle shares fell 13% Thursday to close around $46, their lowest level since early last year. The stock, which has lost about a quarter of its value so far this year, has trailed broader market returns amid concerns over weaker consumer spending and tariff-related cost pressures.
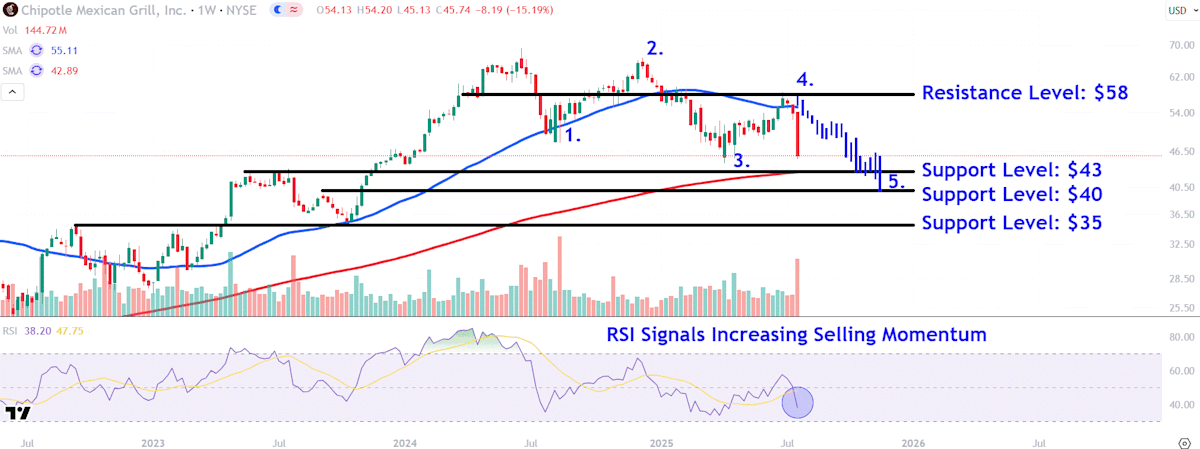
Below, we take a closer look at Chipotle’s weekly chart and apply technical analysis to identify major price levels worth watching out for.
After reclaiming the 50-week moving average (MA) late last month, Chipotle shares had reversed lower ahead the Burrito maker’s earnings report.
What’s more, the retracement coincided with the relative strength index falling below its neutral threshold, signaling increasing selling momentum.
Let’s point out three major support levels to watch on Chipotle’s chart amid the earnings-driven sell-off and also identify a key resistance level worth monitoring during future recovery efforts.
Follow-through selling could bring the $43 level into play. The shares may attract buying interest in this location near a series of closely aligned highs that formed on the chart in May, June and July of 2023, with the area also currently positioned near the 200-week MA.
Selling below this level could see the share price revisit lower support near $40, a region where investors may look for entry points near the September 2023 countertrend high. This area also sits in the same neighborhood as a projected bars pattern target that takes the price bars during the stock’s downtrend from December last year to April this year and repositions them from this month’s high. Such a move would round out an Elliot Wave pattern with five distinct price swings.
A more significant drop sets the stage for a retest of the $35 level. Investors could seek buy-and-hold opportunities in this location near the notable September 2022 swing high and October 2023 swing low.
During future recovery efforts in Chipotle shares, it’s worth monitoring how the price responds to the $58 level. This area on the chart could provide overhead selling pressure near last month’s prominent peak, which touches a horizontal line stretching back to March last year.


