


This post presents an update of the economic forecasts generated by the Federal Reserve Bank of New York’s dynamic stochastic general equilibrium (DSGE) model. We describe very briefly our forecast and its change since December 2023. As usual, we wish to remind our readers that the DSGE model forecast is not an official New York Fed forecast, but only an input to the Research staff’s overall forecasting process. For more information about the model and variables discussed here, see our DSGE model Q & A.
The New York Fed model forecasts use data released through 2023:Q4, augmented for 2024:Q1 with the median forecasts for real GDP growth and core PCE inflation from the January release of the Philadelphia Fed Survey of Professional Forecasters (SPF), as well as the yields on ten-year Treasury securities and Baa corporate bonds based on 2024:Q1 averages up to February 27. Starting in 2021:Q4, the expected federal funds rate (FFR) between one and six quarters into the future is restricted to equal the corresponding median point forecast from the latest available Survey of Primary Dealers (SPD) in the corresponding quarter. For the current projection, this is the January SPD.
Once again, the model was surprised by the strength of the economy. The model attributes this forecast error in part to higher-than-expected productivity, and in part to stimulative financial conditions. This positive surprise leads to a sizable upward revision of the output growth projections for 2024 relative to the December forecast (1.9 versus 1.2 percent). Growth projections for the remainder of the forecast horizon are not very different from what they were in December (0.7, 0.5, and 1.0 percent in 2025, 2026, and 2027 versus 0.7, 0.9, and 1.5 percent in December, respectively). Inflation projections are slightly lower in 2024 than they were in December (2.0 versus 2.2 percent), mostly because 2023:Q4 inflation surprised the model on the downside (although we should note that the model did not take into account the January core PCE readings, as they were not yet incorporated in the February SPF nowcast). The expected path for inflation is otherwise essentially the same as in December (2.0, 2.1, and 2.2 percent in 2025, 2026, and 2027 versus 2.0, 2.0, and 2.1 percent in December, respectively).
The short-run real natural rate of interest is expected to remain at roughly the same elevated level as projected in December for 2024 (2.1 percent versus 2.2 percent in December), declining to 1.9 percent in 2025, 1.6 percent in 2026, and 1.4 percent in 2027. The expected path of the policy rate is essentially unchanged relative to December. The model continues to see policy as being restrictive through the end of 2024, with the real federal funds rate remaining above the short-term natural rate of interest.
Forecast Comparison
| Forecast Period | 2024 | 2025 | 2026 | 2027 | ||||
|---|---|---|---|---|---|---|---|---|
| Date of Forecast | Mar 24 | Dec 23 | Mar 24 | Dec 23 | Mar 24 | Dec 23 | Mar 24 | Dec 23 |
| GDP growth (Q4/Q4) |
1.9 (-2.2, 6.1) |
1.2 (-3.8, 6.2) |
0.7 (-4.3, 5.6) |
0.7 (-4.3, 5.7) |
0.5 (-4.7, 5.8) |
0.9 (-4.5, 6.3) |
1.0 (-4.6, 6.5) |
1.5 (-4.1, 7.1) |
| Core PCE inflation (Q4/Q4) |
2.0 (1.5, 2.6) |
2.2 (1.5, 2.9) |
2.0 (1.1, 2.8) |
2.0 (1.1, 2.9) |
2.1 (1.1, 3.0) |
2.0 (1.0, 3.0) |
2.2 (1.1, 3.3) |
2.1 (1.0, 3.1) |
| Real natural rate of interest (Q4) |
2.1 (0.8, 3.4) |
2.2 (0.8, 3.6) |
1.9 (0.4, 3.3) |
1.8 (0.3, 3.3) |
1.6 (0.0, 3.2) |
1.6 (0.0, 3.2) |
1.4 (-0.3, 3.1) |
1.4 (-0.3, 3.1) |
Notes: This table lists the forecasts of output growth, core PCE inflation, and the real natural rate of interest from the March 2024 and December 2023 forecasts. The numbers outside parentheses are the mean forecasts, and the numbers in parentheses are the 68 percent bands.
Forecasts of Output Growth
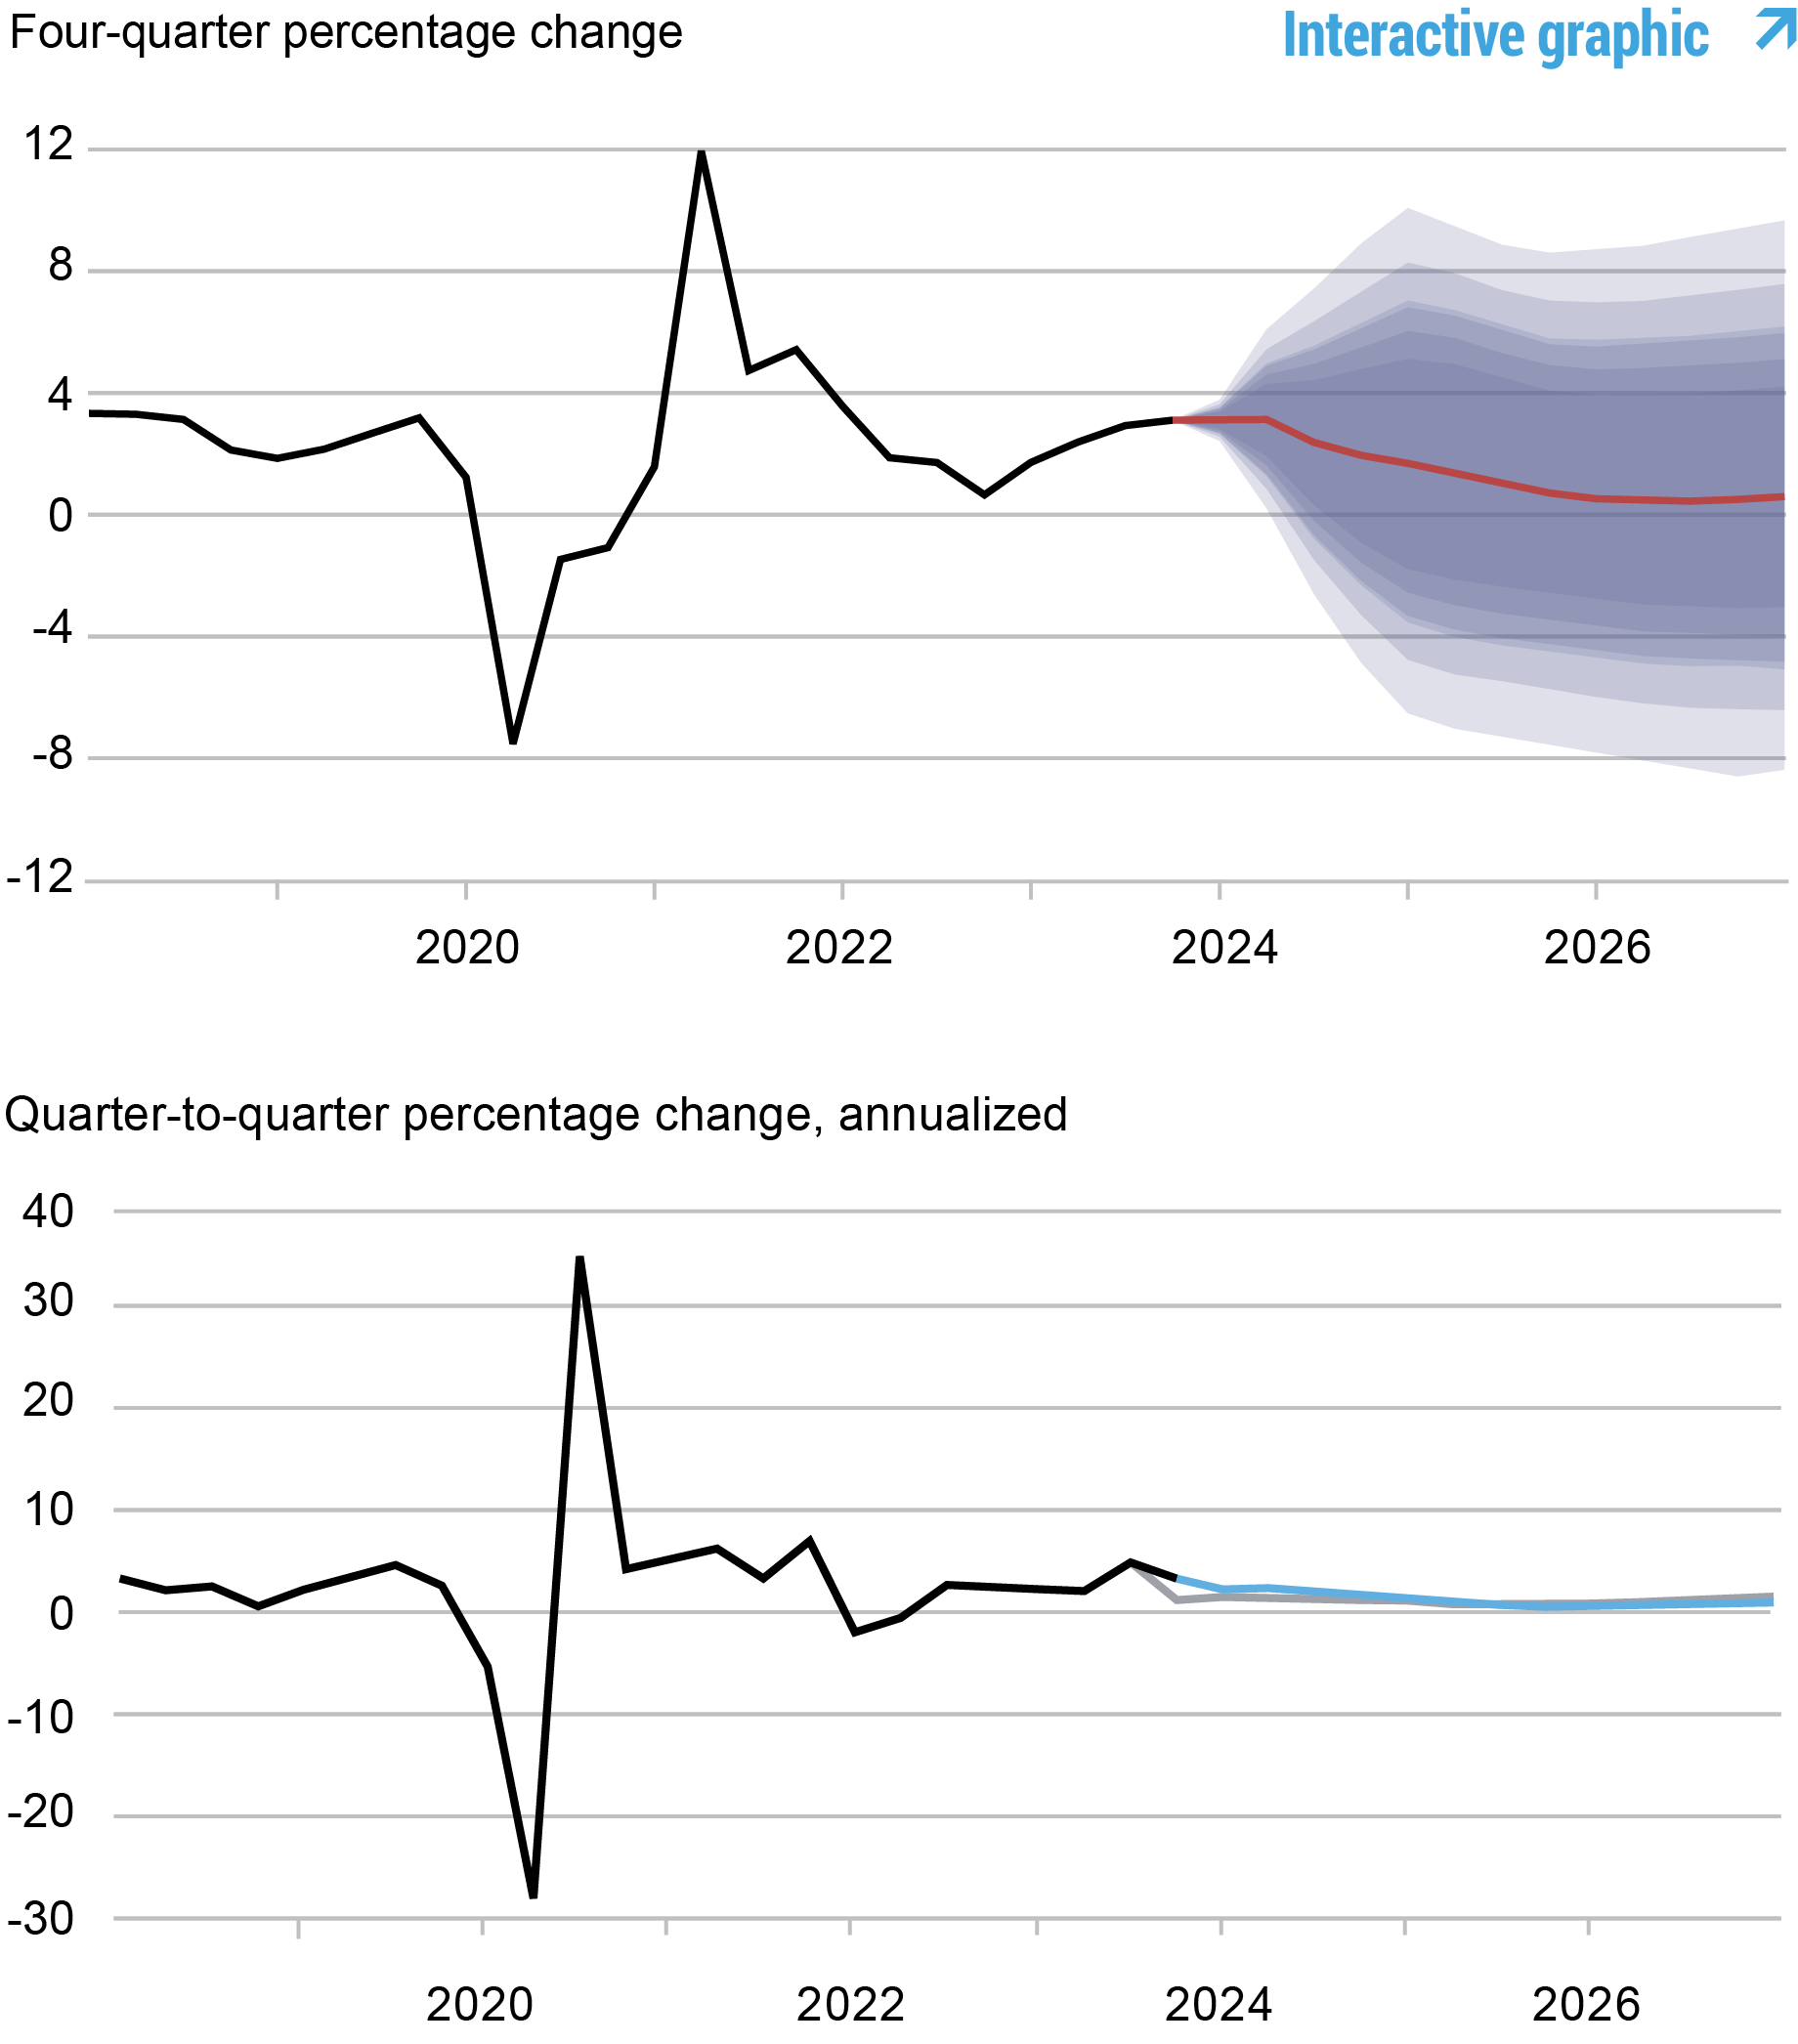
Source: Authors’ calculations.
Notes: These two panels depict output growth. In the top panel, the black line indicates actual data and the red line shows the model forecasts. The shaded areas mark the uncertainty associated with our forecasts at 50, 60, 70, 80, and 90 percent probability intervals. In the bottom panel, the blue line shows the current forecast (quarter-to-quarter, annualized), and the gray line shows the December 2023 forecast.
Forecasts of Inflation
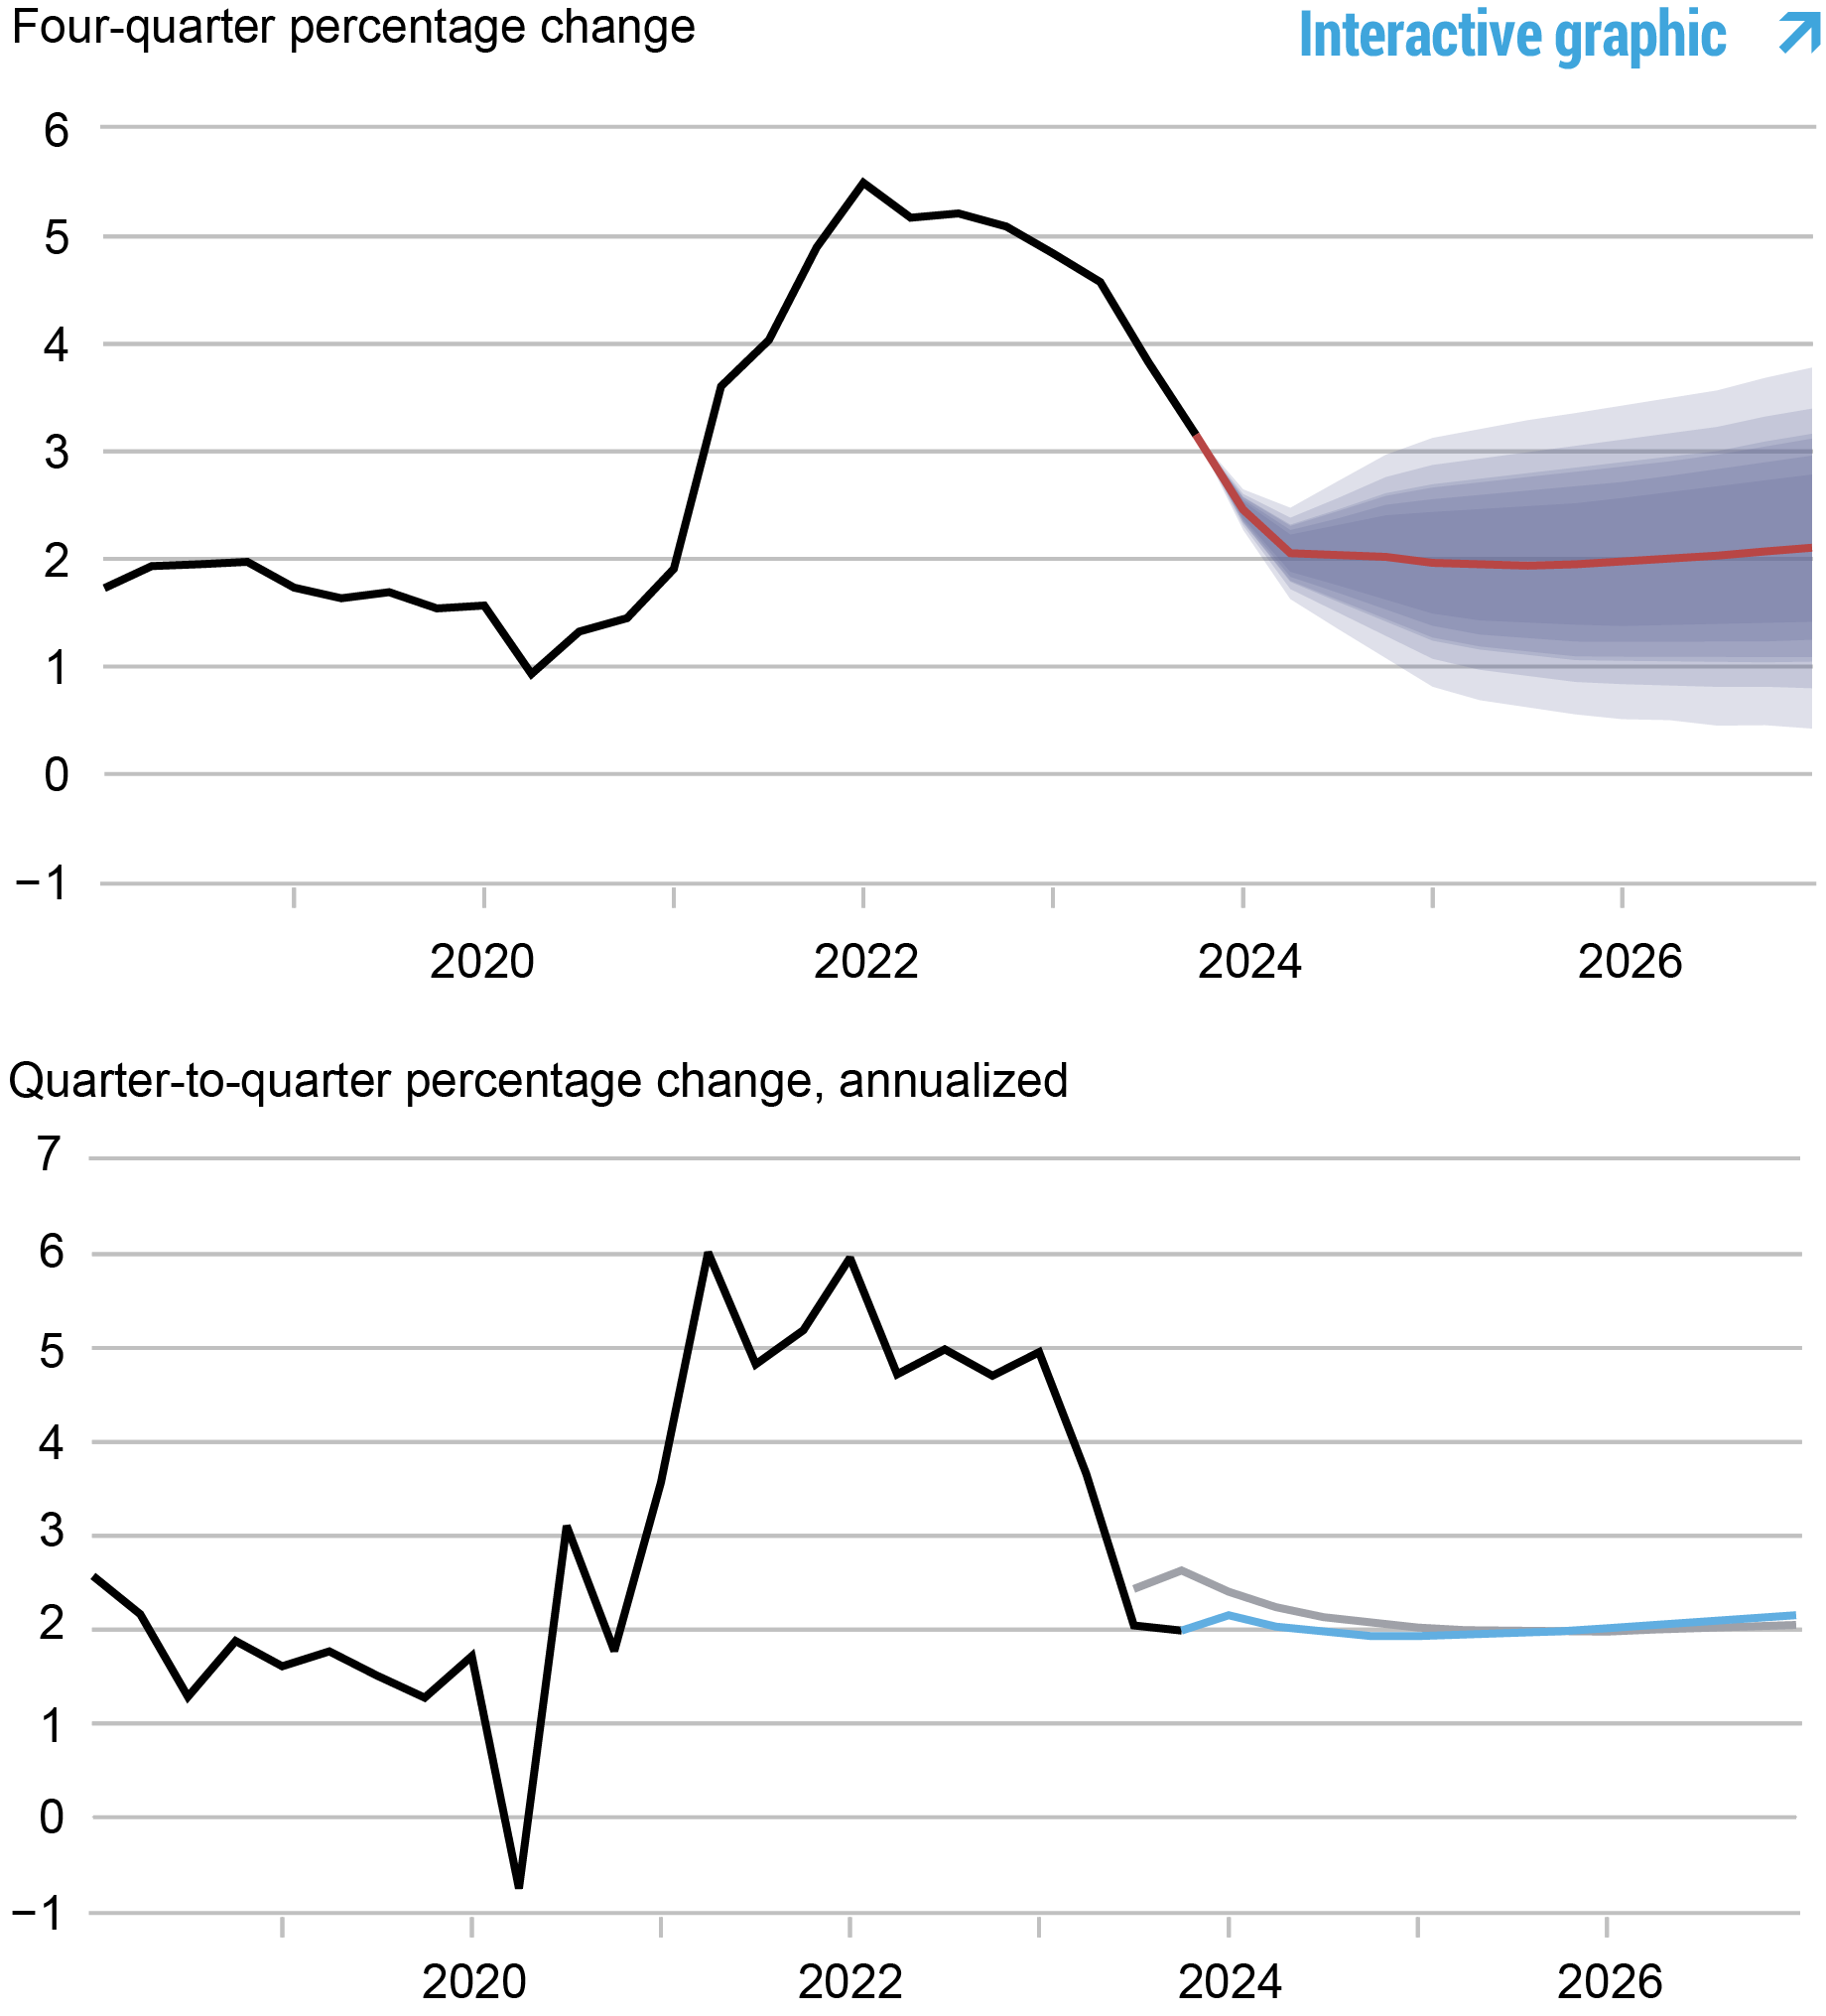
Source: Authors’ calculations.
Notes: These two panels depict core personal consumption expenditures (PCE) inflation. In the top panel, the black line indicates actual data and the red line shows the model forecasts. The shaded areas mark the uncertainty associated with our forecasts at 50, 60, 70, 80, and 90 percent probability intervals. In the bottom panel, the blue line shows the current forecast (quarter-to-quarter, annualized), and the gray line shows the December 2023 forecast.
Real Natural Rate of Interest
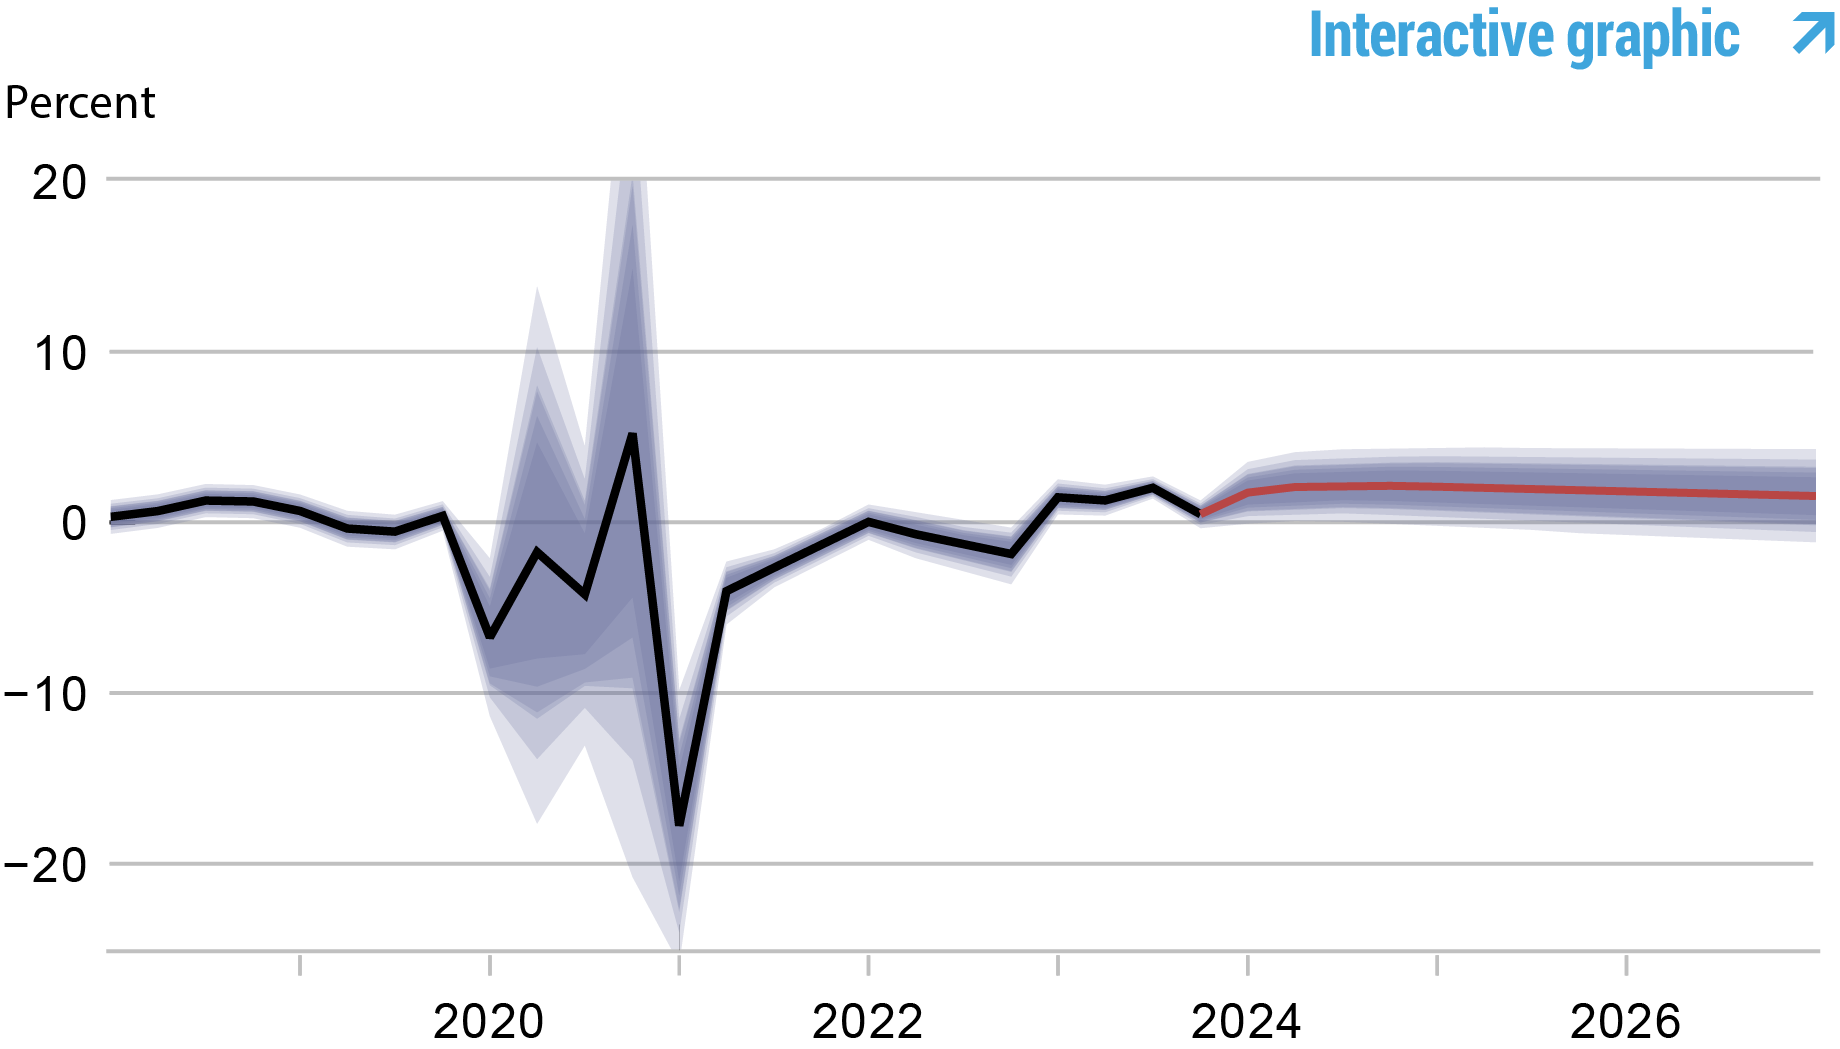
Source: Authors’ calculations.
Notes: The black line shows the model’s mean estimate of the real natural rate of interest; the red line shows the model forecast of the real natural rate. The shaded area marks the uncertainty associated with the forecasts at 50, 60, 70, 80, and 90 percent probability intervals.

Marco Del Negro is an economic research advisor in Macroeconomic and Monetary Studies in the Federal Reserve Bank of New York’s Research and Statistics Group.

Pranay Gundam is a research analyst in the Bank’s Research and Statistics Group.

Donggyu Lee is a research economist in Macroeconomic and Monetary Studies in the Federal Reserve Bank of New York’s Research and Statistics Group.

Ramya Nallamotu is a research analyst in the Bank’s Research and Statistics Group.

Brian Pacula is a research analyst in the Bank’s Research and Statistics Group.
How to cite this post:
Marco Del Negro, Pranay Gundam, Donggyu Lee, Ramya Nallamotu, and Brian Pacula, “The New York Fed DSGE Model Forecast—March 2024,” Federal Reserve Bank of New York Liberty Street Economics, March 22, 2024, https://libertystreeteconomics.newyorkfed.org/2024/03/the-new-york-fed-dsge-model-forecast-march-2024/.
Disclaimer
The views expressed in this post are those of the author(s) and do not necessarily reflect the position of the Federal Reserve Bank of New York or the Federal Reserve System. Any errors or omissions are the responsibility of the author(s).